Articles I wrote for the HubSpot engineering blog
- Building a Fast, Thread-safe Hotspot Tracking Library
- Improving Database Reliability: Preventing Hotspotting with Client-side Request Deduplication
Automated Savings Calculations
This was my primary assignment during my co-op at FirstFuel Software. I designed and implemented a web application that streamlines the way that energy engineers calculate the energy savings potential in the buildings they audit. This was a complete overhaul of their old process, which involved performing all the calculations manually in Excel.
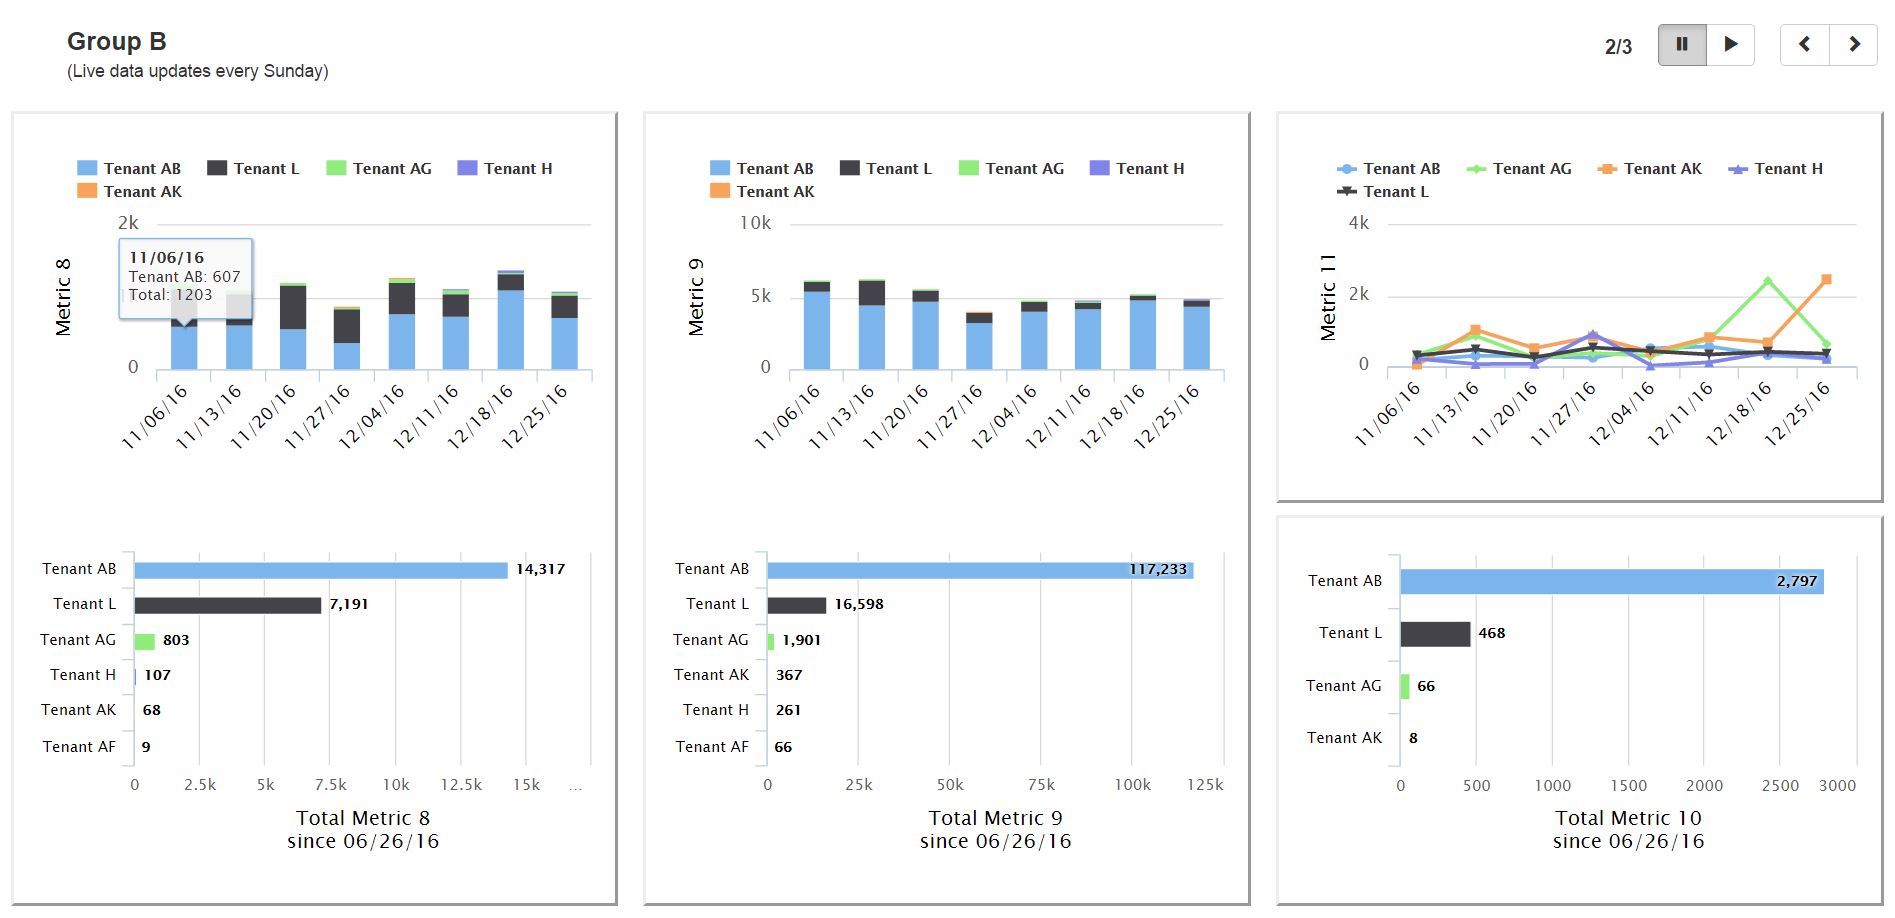
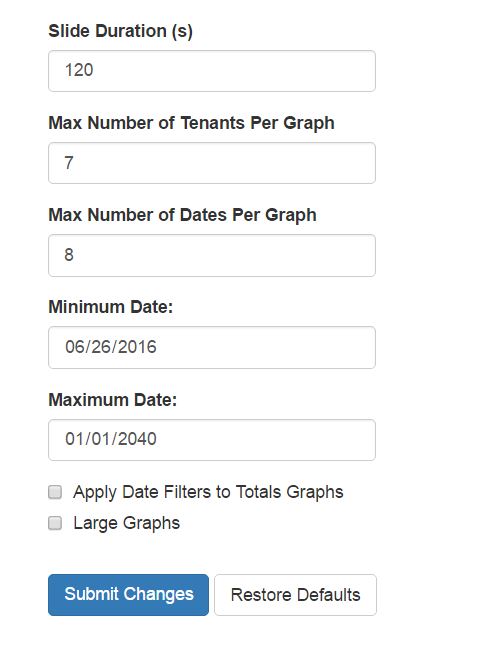
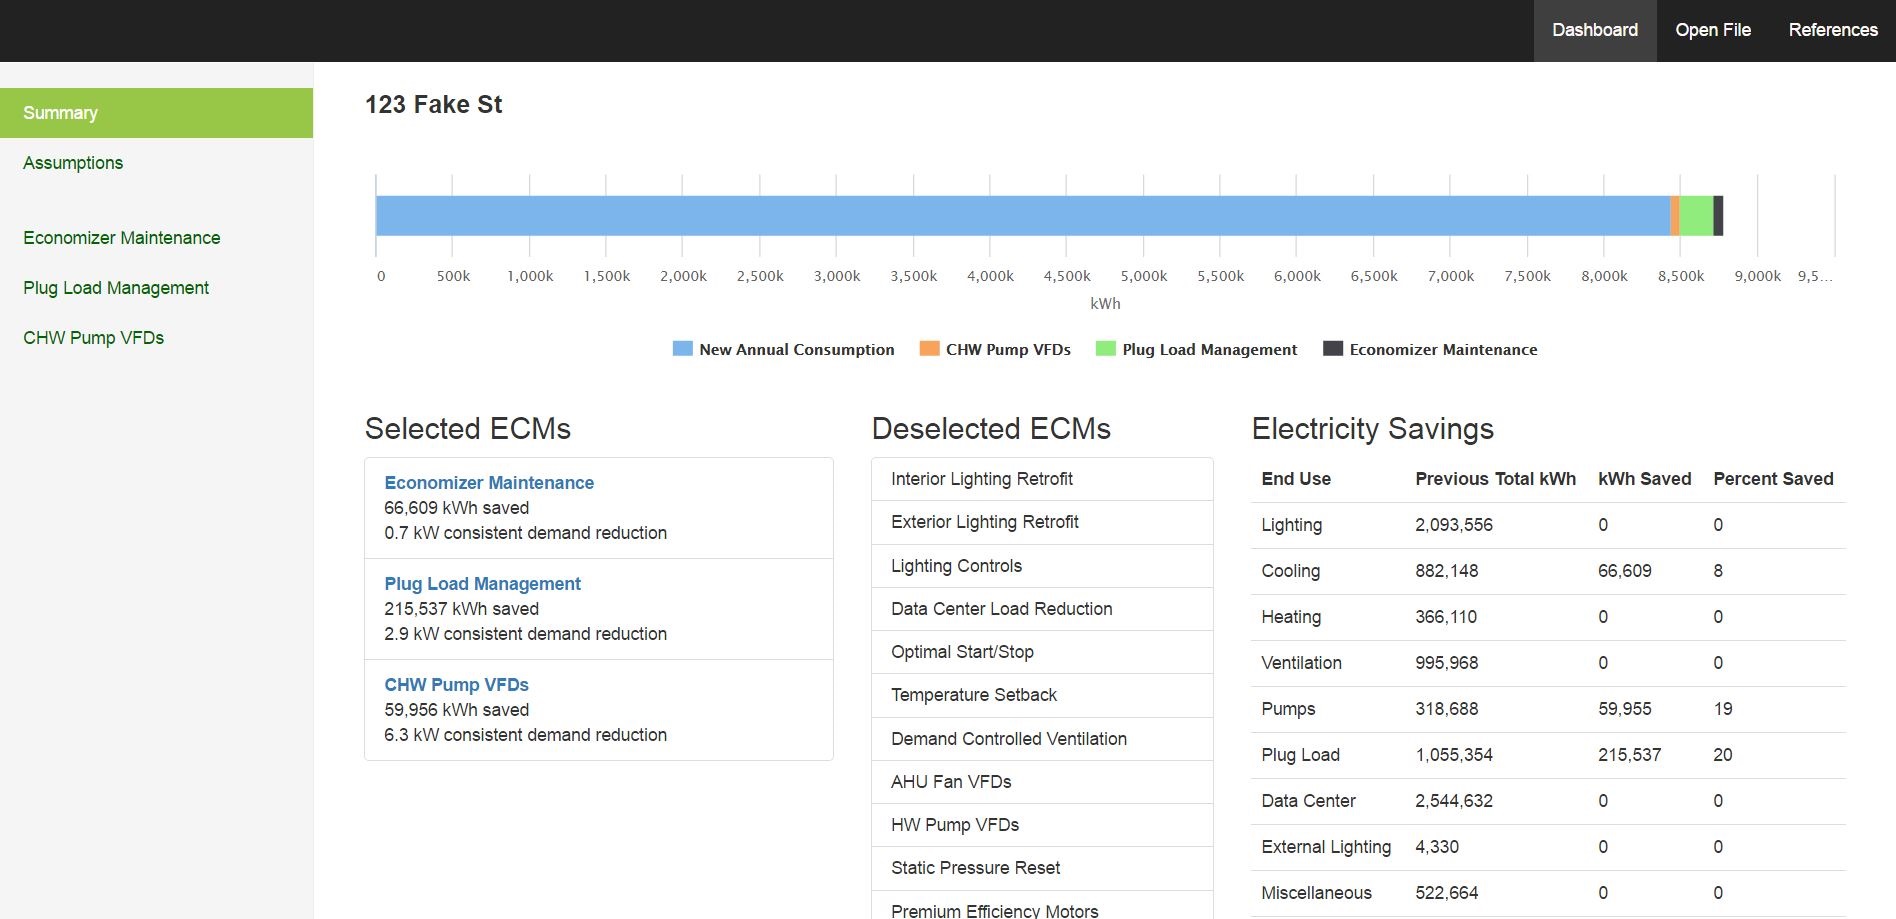
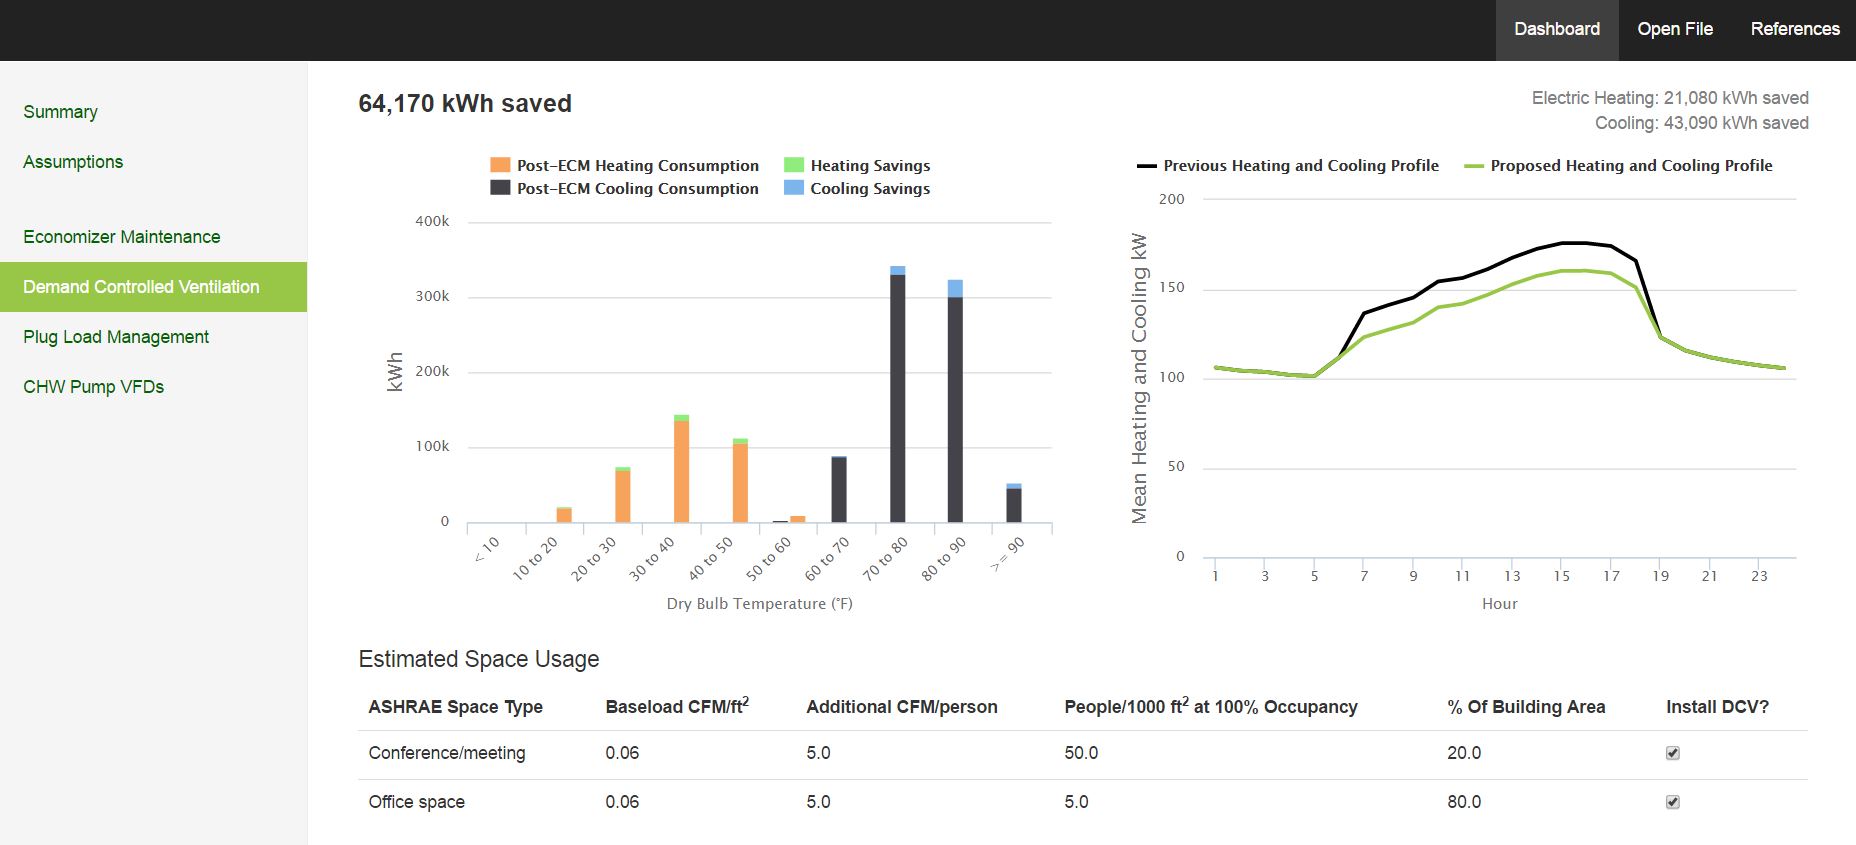
Engineers first upload files containing all known data about their building. Once the building data is uploaded, they use the app to tweak their assumptions about the current state of the building (hours of operation, temperature controls, etc.). Then, they select energy conservation measures that they would like to suggest for the building. Each conservation measure has a unique page that allows the engineer to control the inputs to the savings model and visualize its predicted energy savings impact. The image below shows a section from one of those pages.
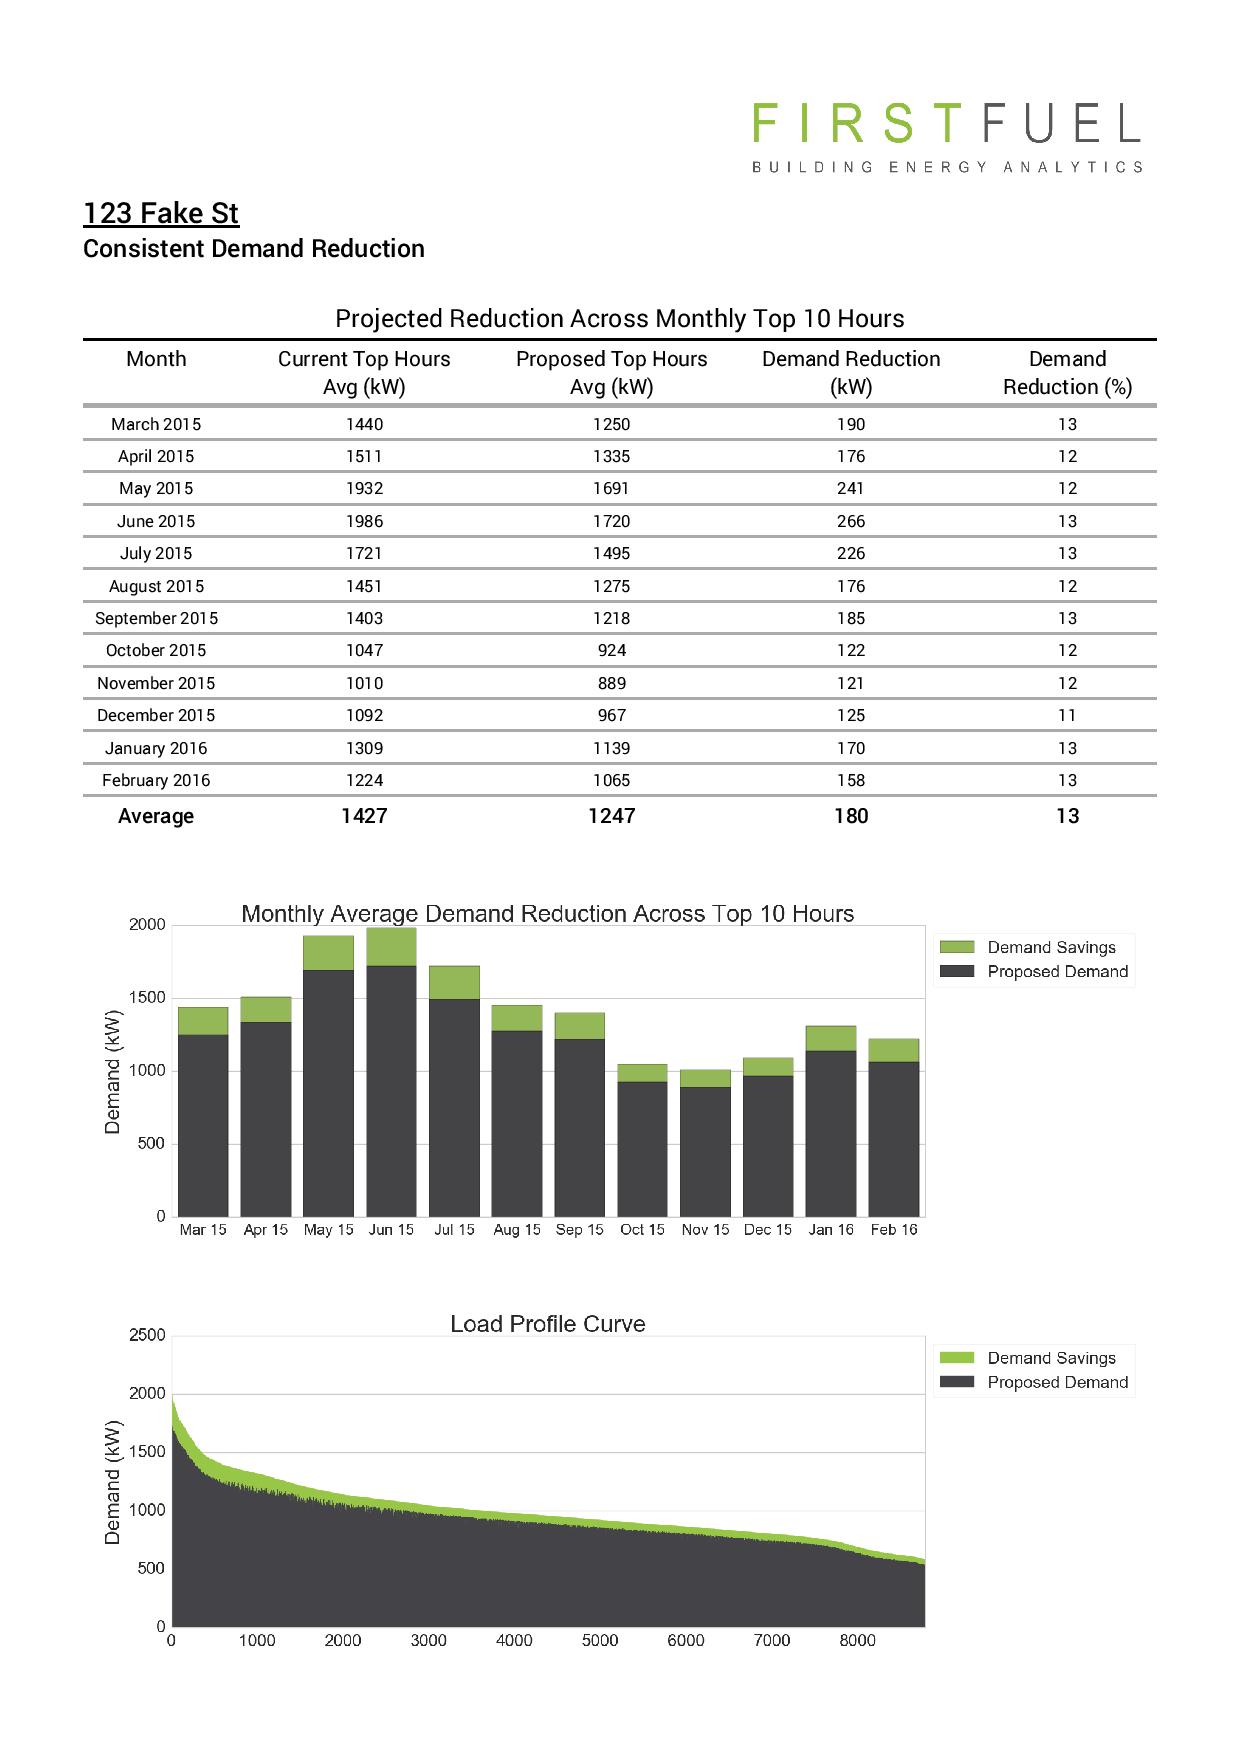
The application also provides a simple, automated way to generate customer-facing documents that detail the engineer's suggestions and savings estimates. This replaced the old, manual process, saving the team hours of time every week. A page from a sample report is shown here.
One of my favorite parts of the project was using my chemical engineering background to come up with improvements to the models used to estimate energy savings. Using principles from thermodynamics and heat transfer, I proposed new calculation methodologies to the team which were codified into the savings models. These models took into account factors like building type, hours of operation, outside air temperature, and humidity to estimate savings for each energy conservation measure on an hour-by-hour basis.
I created the application's backend in Python using Flask. Numpy and pandas were used for all the computationally expensive data processing. These optimized computing packages keep the user experience quick and responsive, even when individual user actions trigger calculations on tens of thousands of rows of data on the backend.
The application is hosted on an Amazon EC2 instance running Amazon's own distribution of Linux, using Apache with mod_wsgi as the server. Amazon S3 was used for all permanent data storage needs.
On the frontend, Bootstrap's column layout and default styles were used extensively. Highcharts was used to generate the interactive charts and graphs shown above. The charts plotted on the customer-facing documents were made using matplotlib. The frontend code was just plain old JavaScript with some jQuery used mainly for DOM manipulation and AJAX requests.
Usage Dashboard
This was a fun side project I completed while at FirstFuel. The company had access to a feed of customer usage data that updated every week, and we wanted to display the data on a screen in the office so that FirstFuel employees could see trends in how our products were being used. The data included metrics that tracked how active users were and how often they used specific features of each product.
I built a web application that functioned as an interactive slideshow where employees could see customer usage data broken down by week. The picture above shows one of these slides (with the real usage data and associated labels modified). Employees can walk up to the display, pause/play the slideshow, and interact with the charts. A cron job running on the Amazon EC2 host regularly checks for new batches of usage data, and when new data is found, a script on the client side detects this change and automatically refreshes the page to fetch the new data.
Additionally, I added a settings page where users could change the properties of the slideshow, such as slide duration and range of dates displayed. These settings were tracked using cookies, so any employee on the VPN could access the slideshow from their own computer using their own personal settings.
I made this app with many of the same technologies as the automated savings calculations app: Python, Flask, pandas, numpy, Linux, Apache, S3, Bootstrap, Javascript, jQuery, and Highcharts.
CloudCart
https://itunes.apple.com/us/app/cloudcart/id1035509564?mt=8I made this iOS app during the summer of 2015. The idea behind it was that families should be able to easily keep a shared, running grocery list every week. Whenever someone thinks of something they want from the store, they can add that item to the shared list from their own device, and then when someone goes shopping later that week, they can look at everyone's requests on their phone at the grocery store.
I wrote the app in Swift. To handle everything on the server-side, I used a backend-as-a-service called Parse, which has an iOS SDK that provides a nice abstraction of the backend. One of the key challenges I had when making this app was allowing users to add, edit, and remove list items while off the network such that those changes would be made in the cloud when their connection was restored. This meant handling edge cases involving conflicts between local and server-side state, which was tricky at times. In order to keep the UI responsive while network requests were being made, I used a lot of multithreaded code, which presented interesting problems as well.